| Vulnerabilities | |||||
|---|---|---|---|---|---|
| Version | Suggest | Low | Medium | High | Critical |
| 3.1.1a1 | 0 | 0 | 0 | 0 | 0 |
| 3.1.0rc1 | 0 | 0 | 0 | 0 | 0 |
| 3.1.0 | 0 | 0 | 0 | 0 | 0 |
| 3.0.1 | 0 | 0 | 0 | 0 | 0 |
| 3.0.1a0 | 0 | 0 | 0 | 0 | 0 |
| 3.0.0a8 | 0 | 0 | 0 | 0 | 0 |
| 3.0.0a7 | 0 | 0 | 0 | 0 | 0 |
| 3.0.0a6 | 0 | 0 | 0 | 0 | 0 |
| 3.0.0a5 | 0 | 0 | 0 | 0 | 0 |
| 3.0.0a4 | 0 | 0 | 0 | 0 | 0 |
| 3.0.0a3 | 0 | 0 | 0 | 0 | 0 |
| 3.0.0a2 | 0 | 0 | 0 | 0 | 0 |
| 3.0.0a1 | 0 | 0 | 0 | 0 | 0 |
| 3.0.0a0 | 0 | 0 | 0 | 0 | 0 |
| 3.0.0 | 0 | 0 | 0 | 0 | 0 |
| 2.0.7a2 | 0 | 0 | 0 | 0 | 0 |
| 2.0.6 | 0 | 0 | 0 | 0 | 0 |
| 2.0.5 | 0 | 0 | 0 | 0 | 0 |
| 2.0.2 | 0 | 0 | 0 | 0 | 0 |
| 2.0.1 | 0 | 0 | 0 | 0 | 0 |
| 2.0.0 | 0 | 0 | 0 | 0 | 0 |
| 1.0.1 | 0 | 0 | 0 | 0 | 0 |
| 0.9.1 | 0 | 0 | 0 | 0 | 0 |
| 0.9.0 | 0 | 0 | 0 | 0 | 0 |
3.1.1a1 - This version is safe to use because it has no known security vulnerabilities at this time. Find out if your coding project uses this component and get notified of any reported security vulnerabilities with Meterian-X Open Source Security Platform
Maintain your licence declarations and avoid unwanted licences to protect your IP the way you intended.
CC-BY-4.0 - Creative Commons Attribution 4.0 International![]()
| Latest release |
    
|
| Python |  |
| Build Status | |
| Coverage | |
| Latest dev release |
 
|
| Documentation |  |
Colorcet is a collection of perceptually uniform colormaps for use with Python plotting programs like bokeh, matplotlib, holoviews, and datashader based on the set of perceptually uniform colormaps created by Peter Kovesi at the Center for Exploration Targeting.
Colorcet supports Python 3.10 and greater on Linux, Windows, and Mac and can be installed with conda:
conda install colorcetor with pip:
python -m pip install colorcetIf you want to try out the latest features between releases, you can get the latest dev release by installing:
conda install -c pyviz/label/dev colorcetFor more information take a look at Getting Started.
You can see all the details about the methods used to create these colormaps in Peter Kovesi's 2015 arXiv paper. Other useful background is available in a 1996 paper from IBM.
The Matplotlib project also has a number of relevant resources, including an excellent 2015 SciPy talk, the viscm tool for creating maps like the four in mpl, the cmocean site collecting a set of maps created by viscm, and the discussion of how the mpl maps were created.
Some of the Colorcet colormaps that have short, memorable names (which are probably the most useful ones) are visible here:
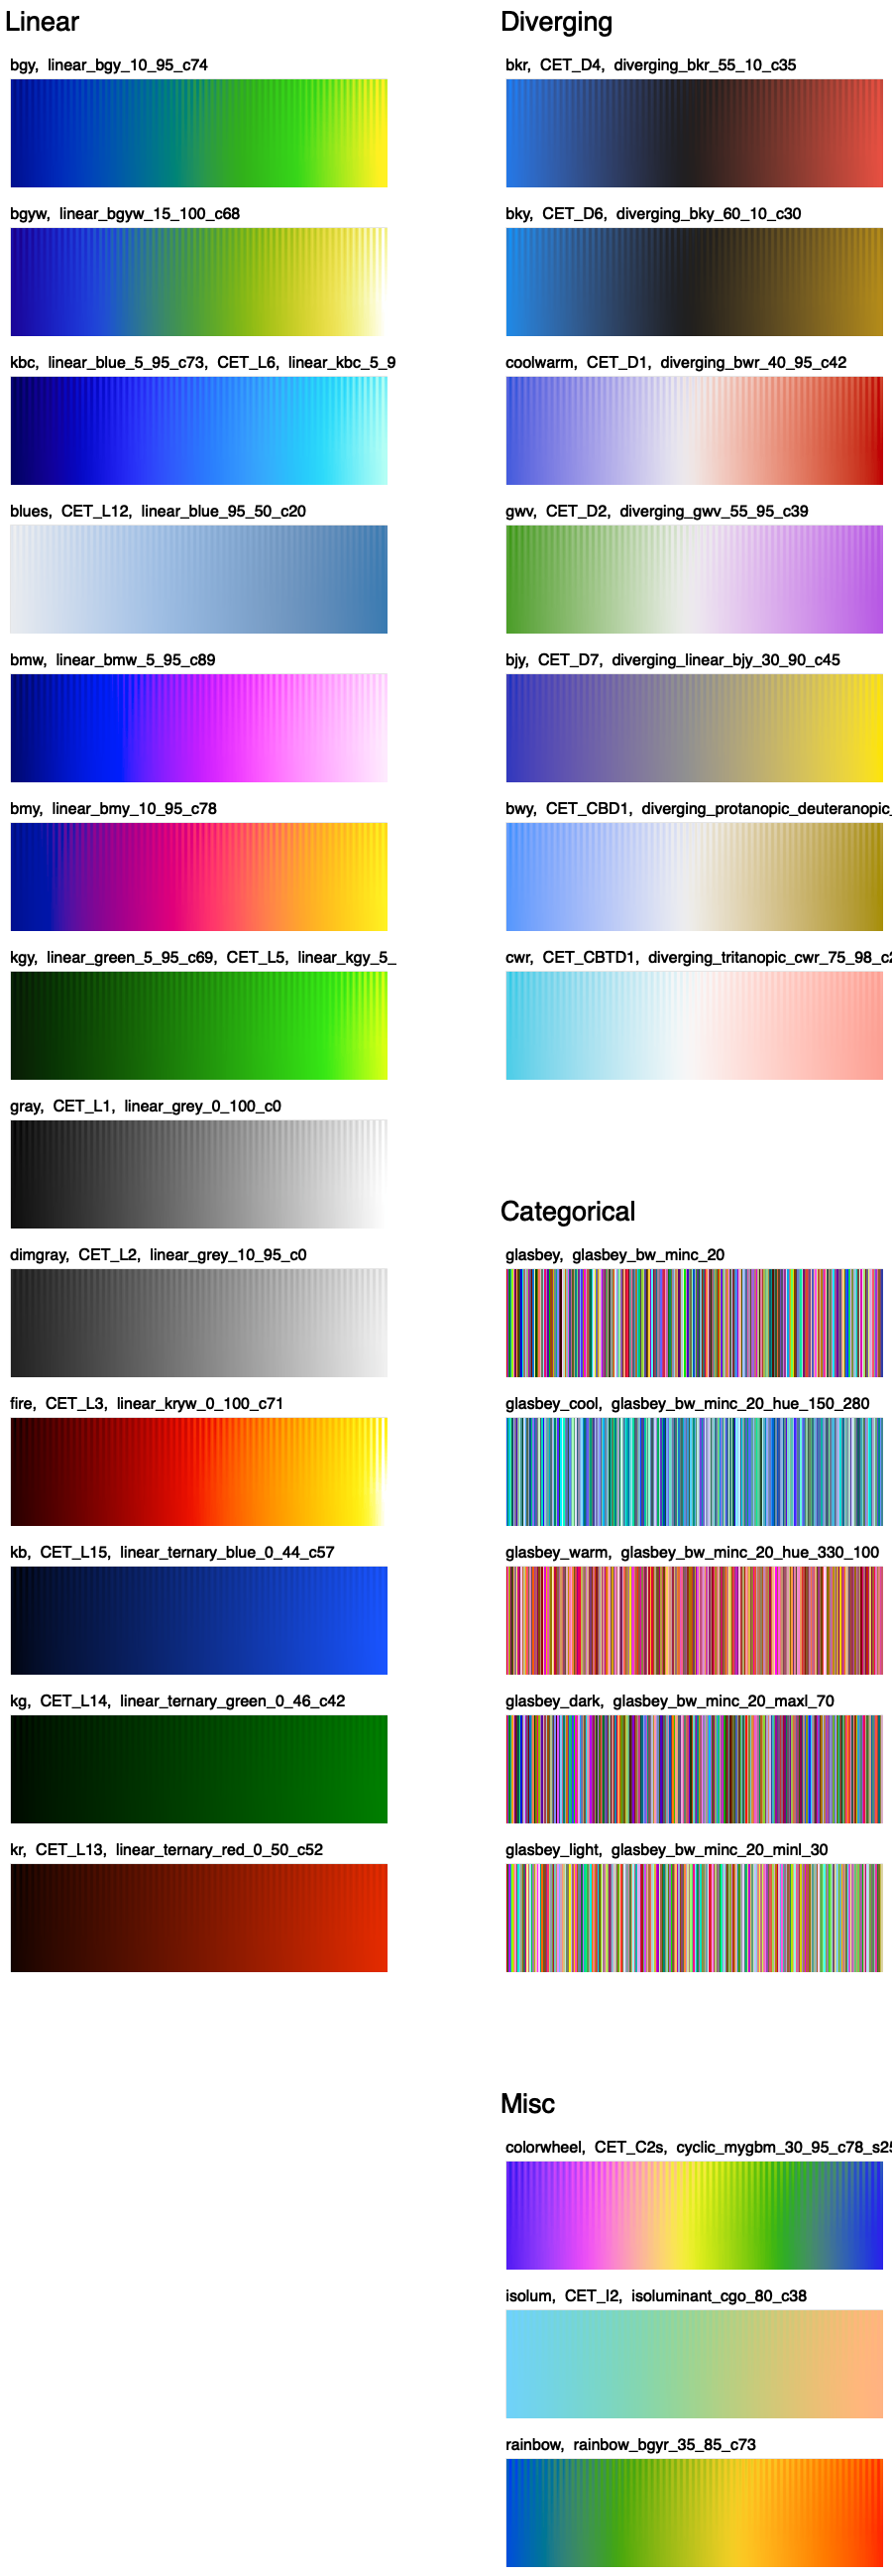
But the complete set of 100+ is shown in the User Guide.

